- Petrolink
- Technology
- Data Quality Dashboards

Set the foundation for analytics
Managing and improving the quality of upstream drilling data has always been important for the energy industry. In recent years, the growing use of analytical tools has made it even more vital to ensure data is accurate, reliable, and complete.
We are all familiar with the term ‘garbage in, garbage out’. Poor quality data remains a real challenge for operators. It can have an immediate impact on operational decisions, and some of these issues might only become apparent after the project has finished. Once an errant piece of data is within a large corporate system, it is nigh on impossible to locate it and roll-back the clock.
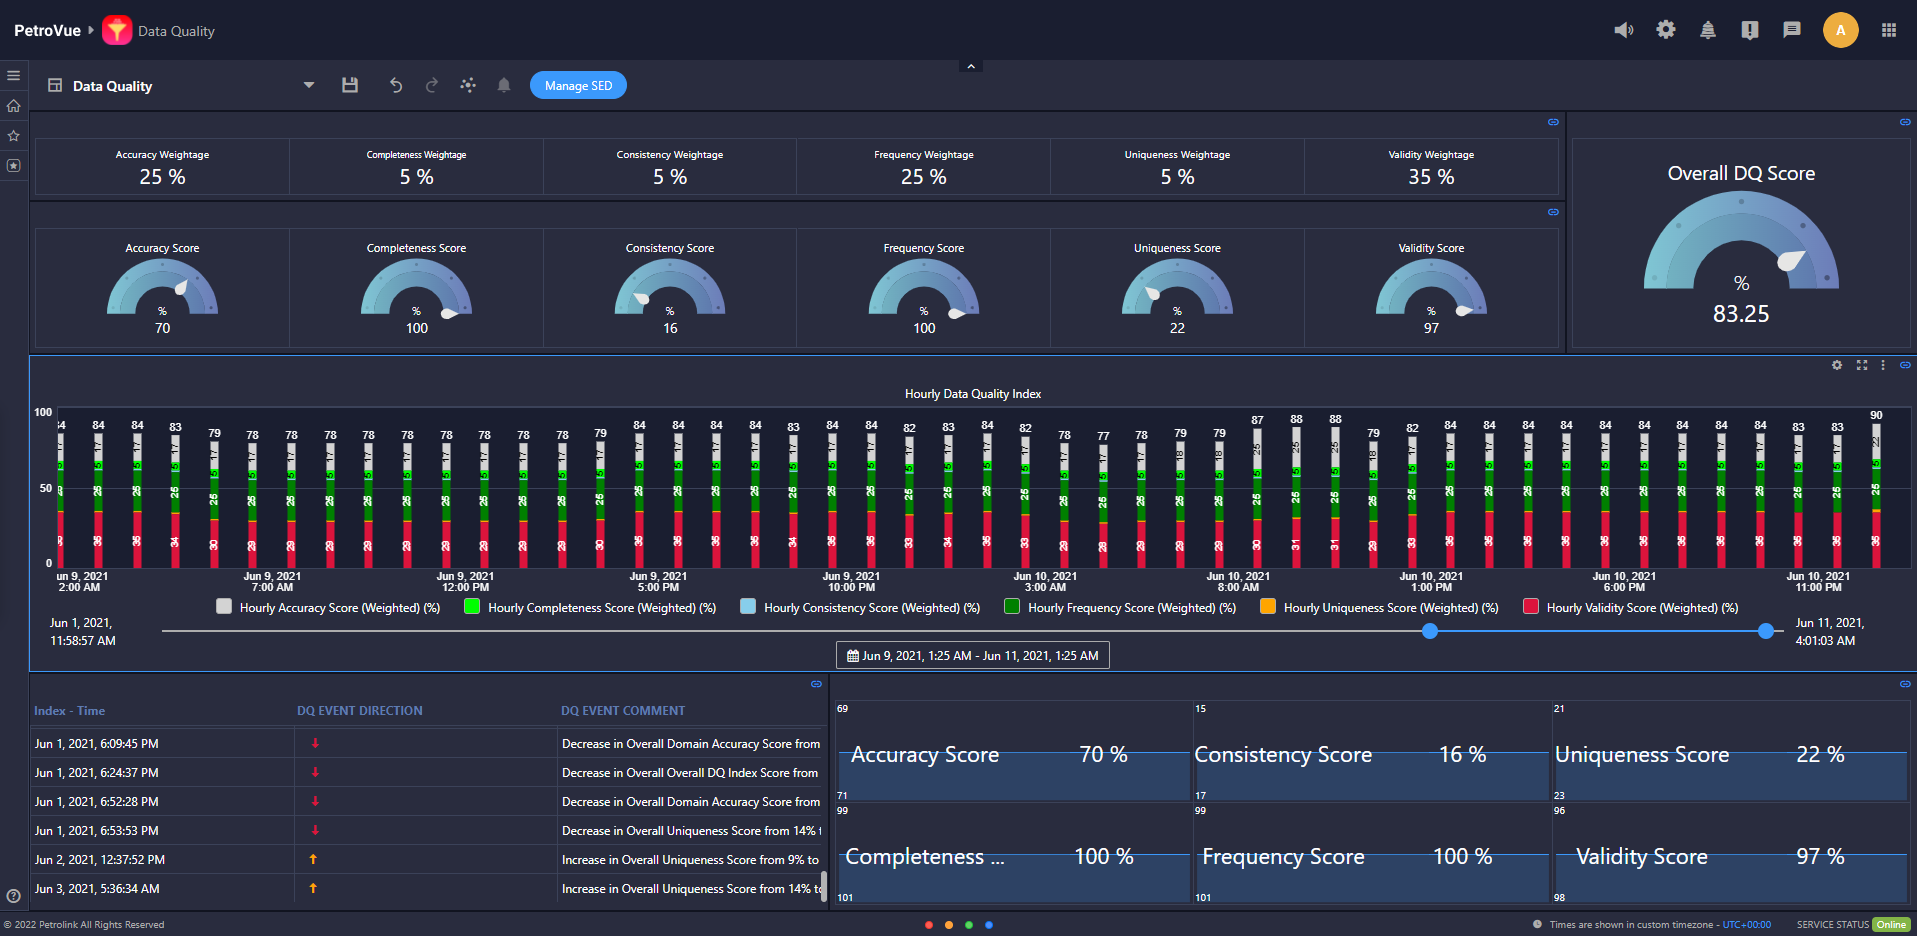
Here at Petrolink, we have developed data quality algorithms which serve as gatekeepers for your real-time data. The algorithms continually check and assess the data, putting you in control and restoring confidence in your data driven decisions.
So, how do we define data quality? What did we factor into the design process? Most importantly, how can you use it to get more from your well data?
Let’s take a look.
In the upstream context, data quality is divided into two camps – availability and usability. This provides a useful framework when approaching the topic of how we define data quality. Let’s take a look at one from each camp – accuracy and completeness.
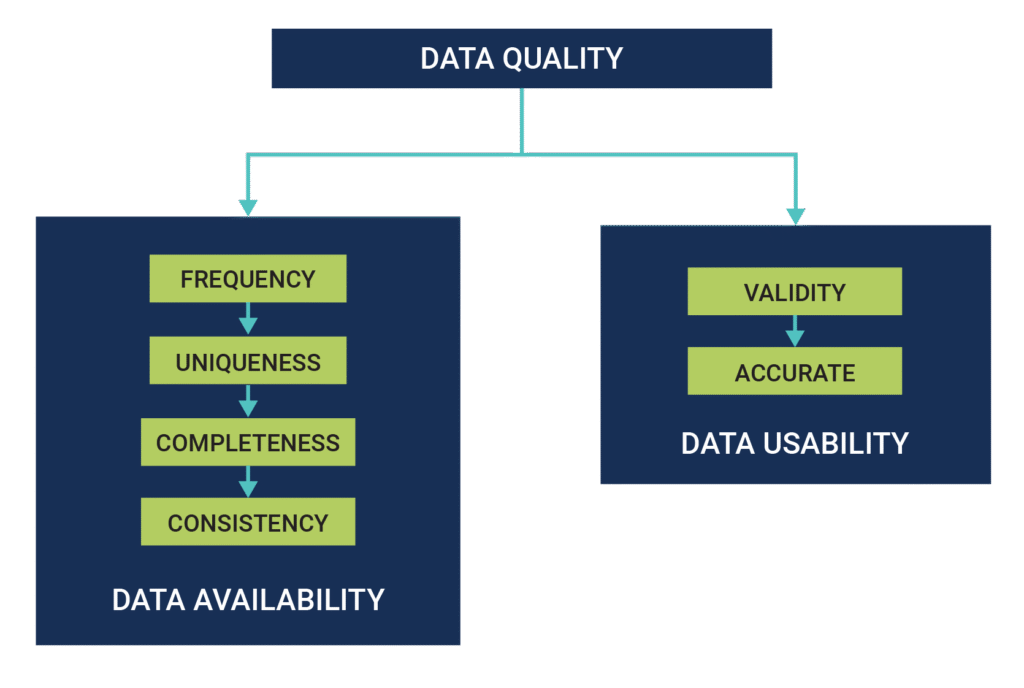
Data accuracy is about assessing how correct the data is and whether it matches what would be expected in a real-world scenario. Take the calculation of rig state, for example. Rig state is a complex algorithm that looks at several data points, including RPM, WOB, and block position. Tracking rig state is vital and issues in the calculation can cause problems when compiling KPI reports during post-well analysis. A problem with just one of those parameters needs to be detected. Imagine that SPP falls to zero, that is simply not possible while drilling.
Completeness
An assessment of completeness boils down to comparing what data is being collected versus what data is expected. Only with a complete data row can meaningful analysis be made. In this example, we see a missing data point for hookload has thrown out the rig-state calculation. The data completeness algorithm catches that and marks that row as incomplete.
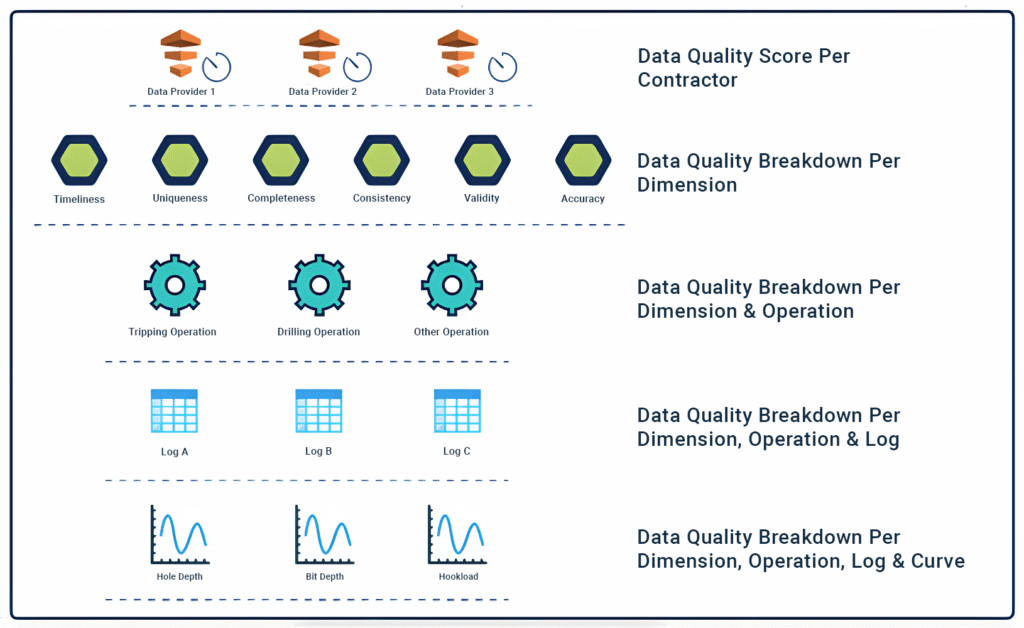
Data Quality 5 Main KPIs
- Frequency – this dimension provides a metric for the anticipated frequency received compared with the agreed frequency determined by the operator.
- Data Validity – This algorithm checks the range of the curve.
- Completeness – Completeness is defined as the proportion of stored/available data against the business expectation of “100% complete”.
- Accuracy – The degree to which data correctly describes the “real world” object or event being described.
- Consistency – The absence of difference when comparing two or more representations of a thing against a definition.
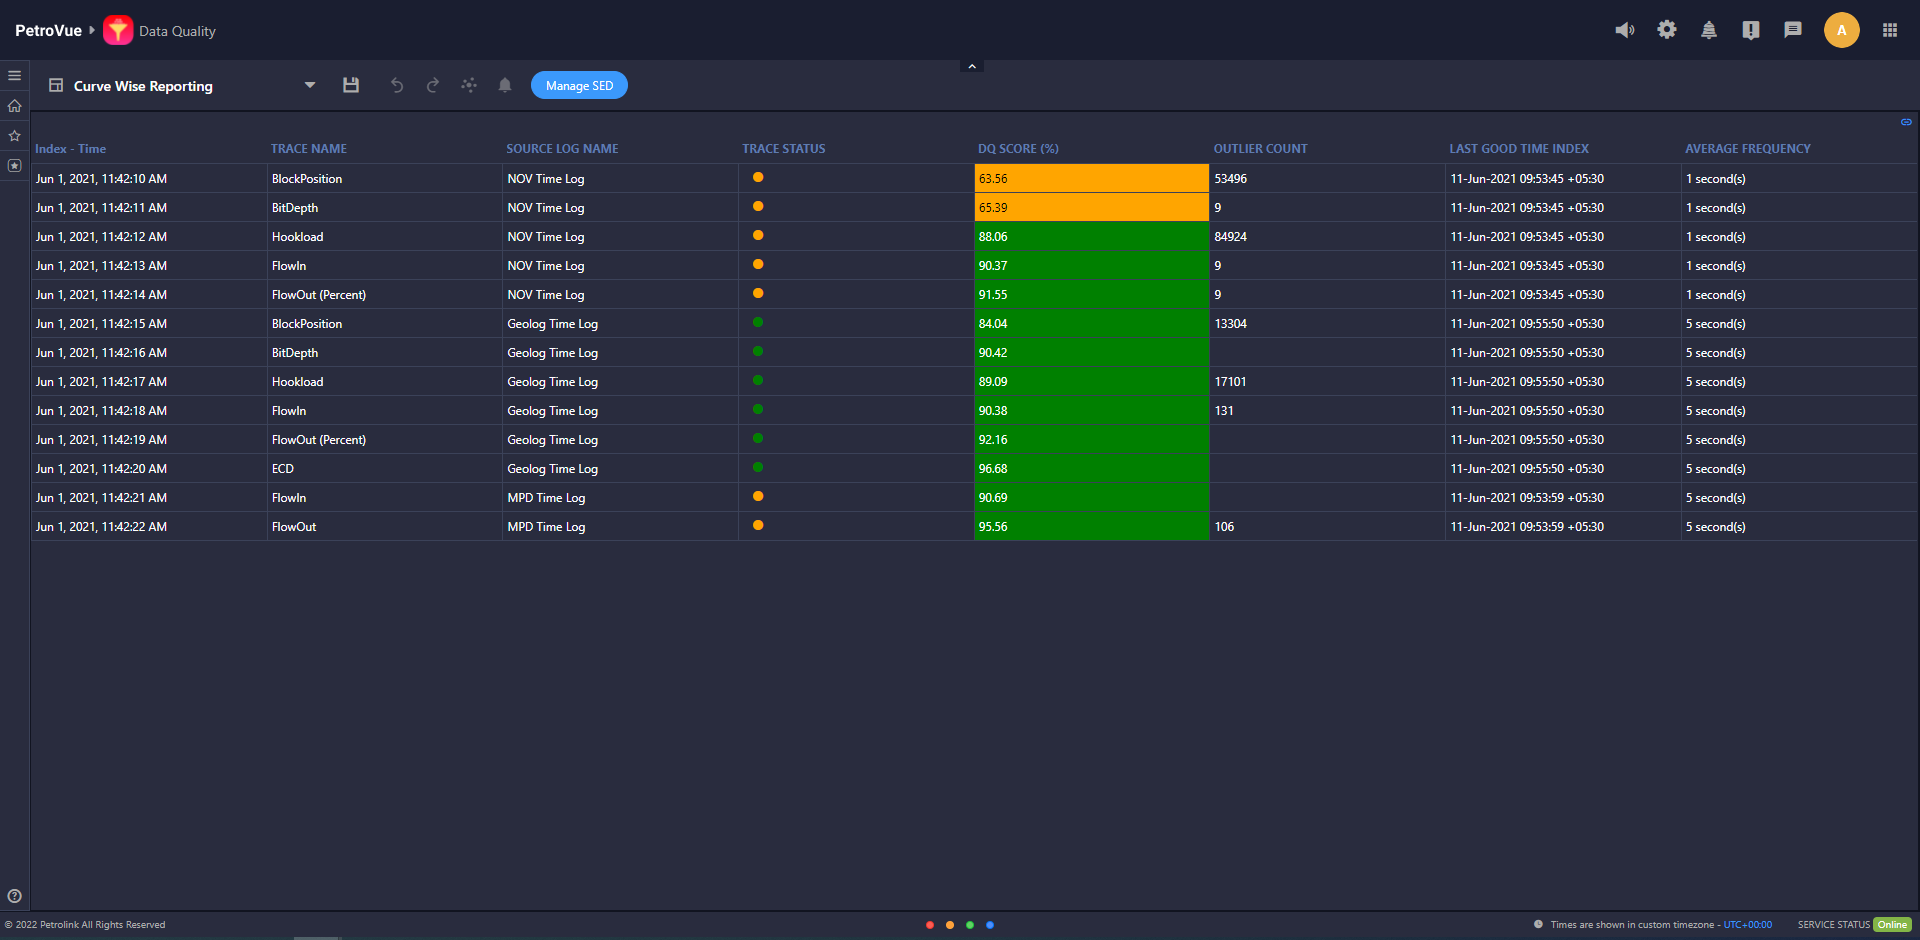
Drilling Down
On many occasions, a quick glance at the dashboard would be enough to make a decision and take immediate action. For example, if the MWD data has become erratic, the crew needs to be informed.
However, throughout the operational phases, the level of analysis required changes. Post well performance across rigs and contractors often needs to be understood. How many data gaps were there? Did data quality vary in the reservoir section?
Deploying a data quality solution is one of the best steps that an operator can take to quantify some of these factors and move beyond just a nebulous sense of how data has been managed.
Petrolink’s Data Quality application has been designed to give you exactly this level of granular understanding. Everyone from engineers at the rig, through to data managers can be assured of actionable information and greater confidence in decisions made using the wellsite data feeds.