![]()
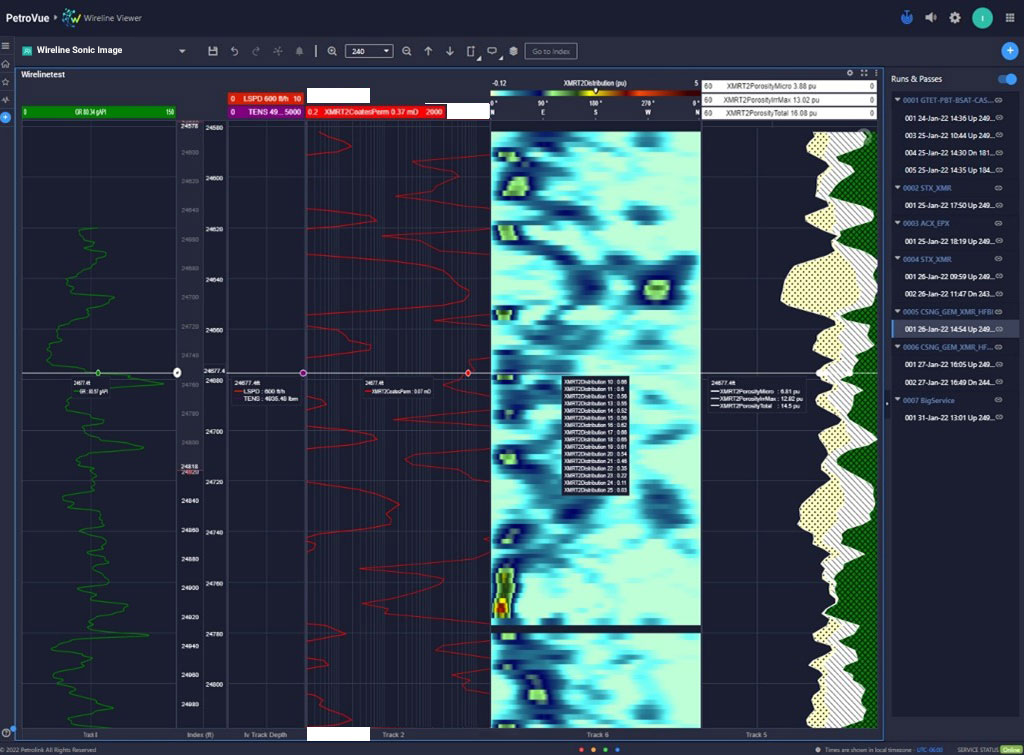
Wireline Viewer
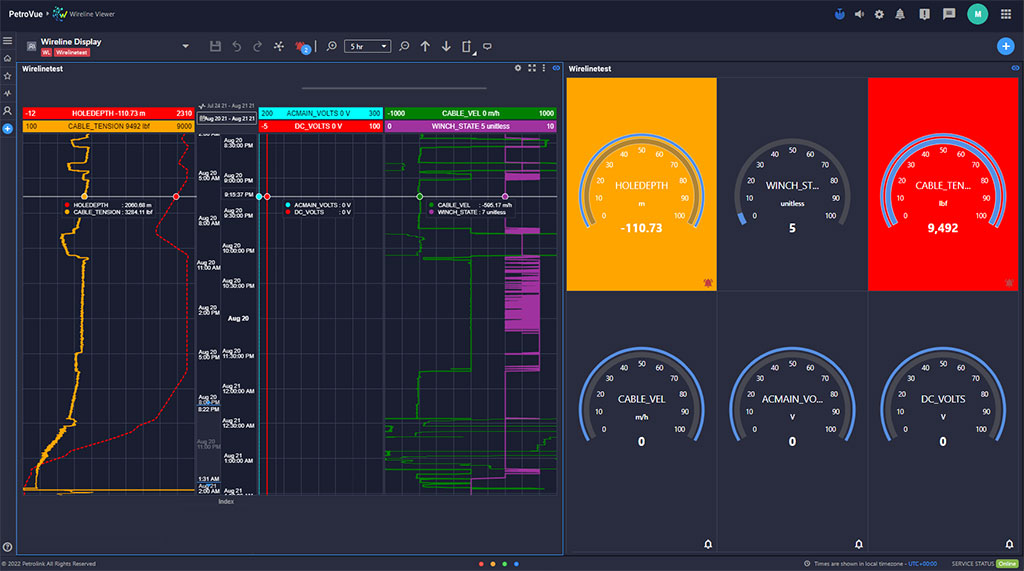
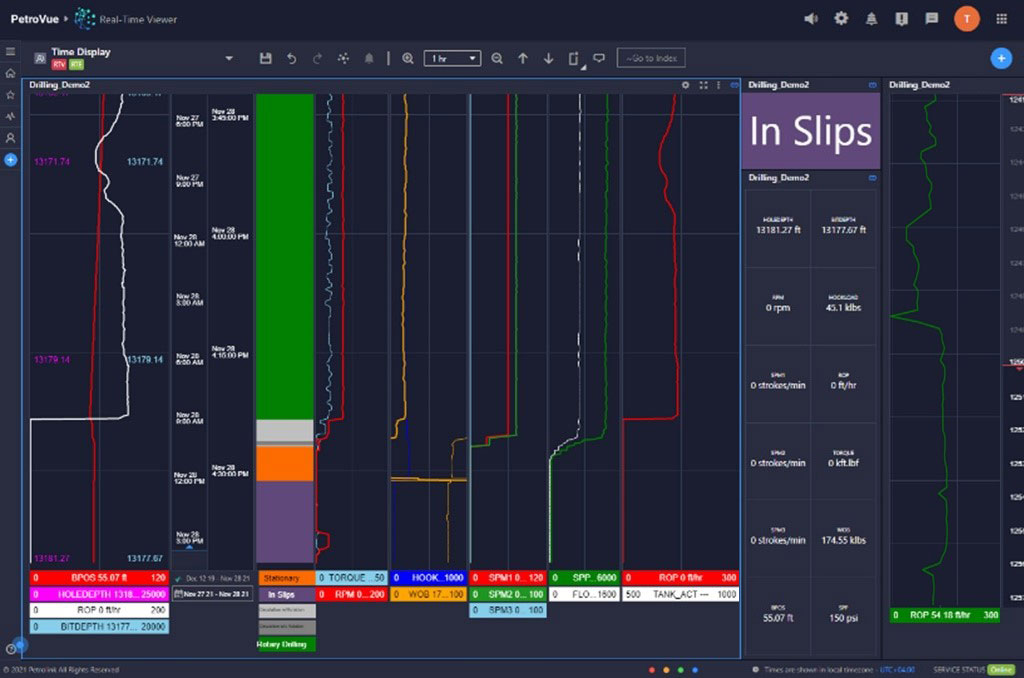
The Wireline application allows you to monitor and review data from runs and passes. Every foot of wireline data matters- with tool responses indicating changes in the overburden or reservoir. When paired with real-time LWD and time-based logs the subsurface team is equipped with the data they need to make decisions on the optimal strategy to complete the well.
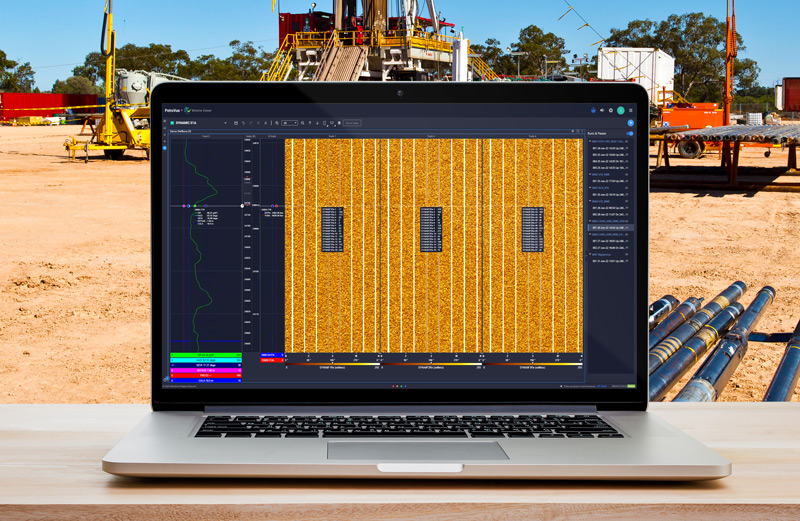
The dedicated Wireline Viewer provides a comprehensive view of wireline data.
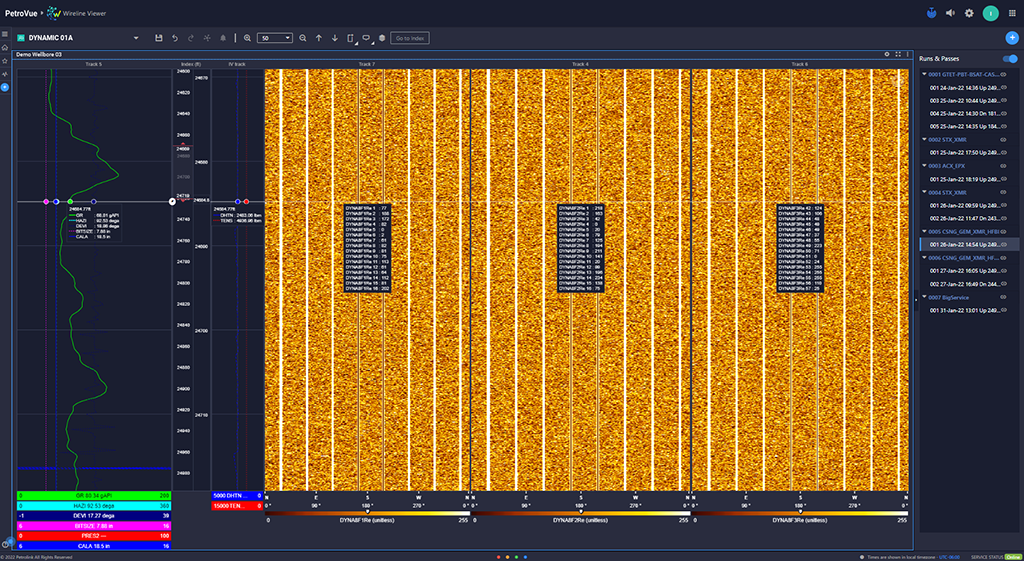
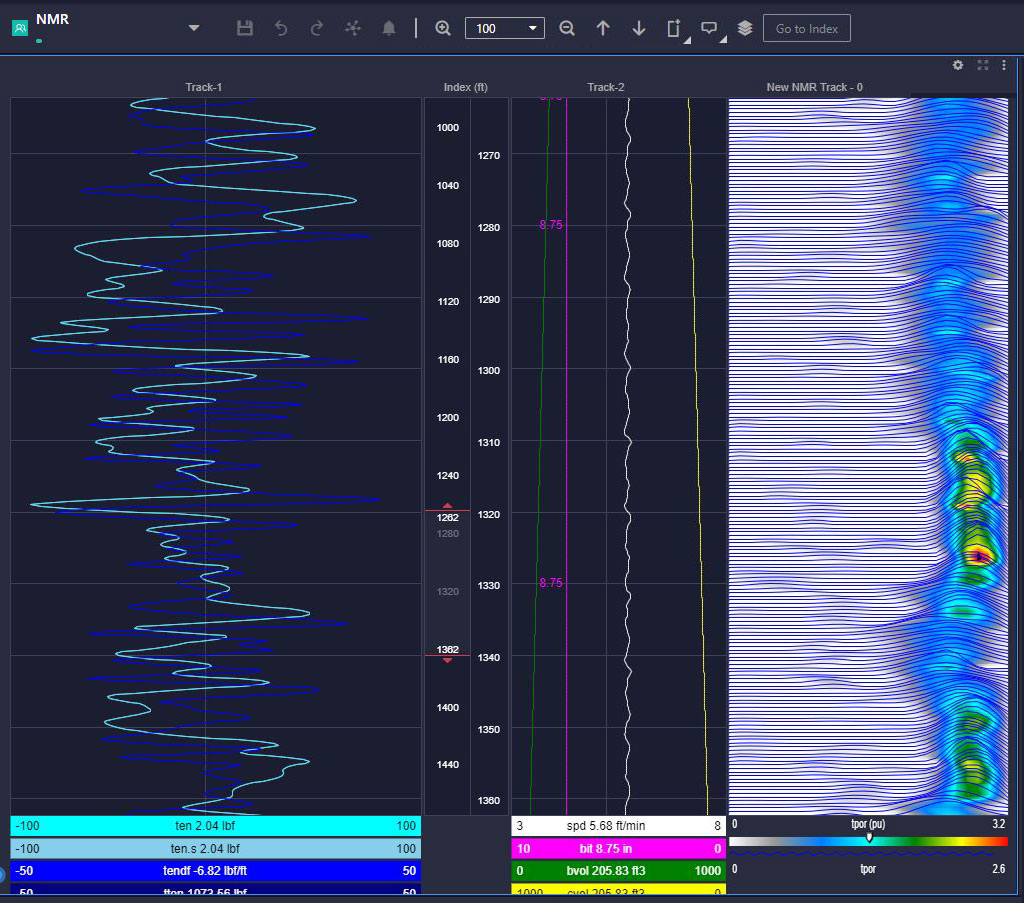
- Visualize high-resolution data
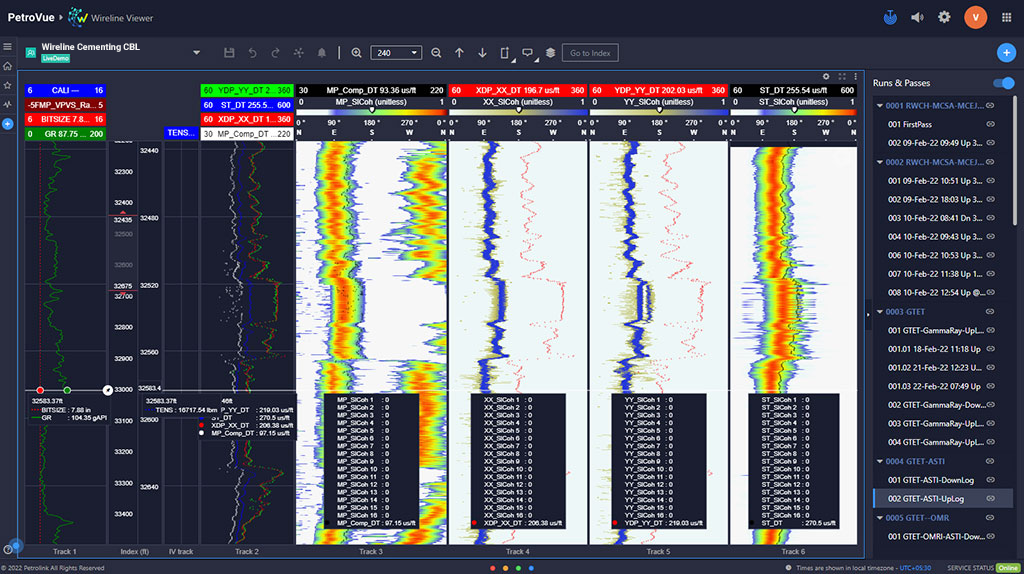
- Log up and log down
- Split logs to cover runs and passes
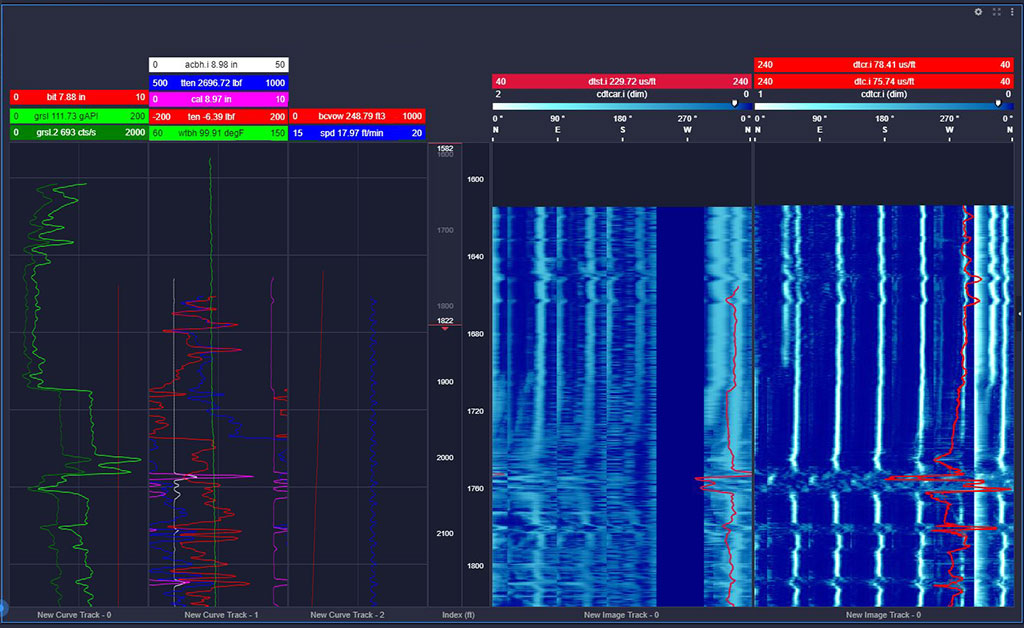
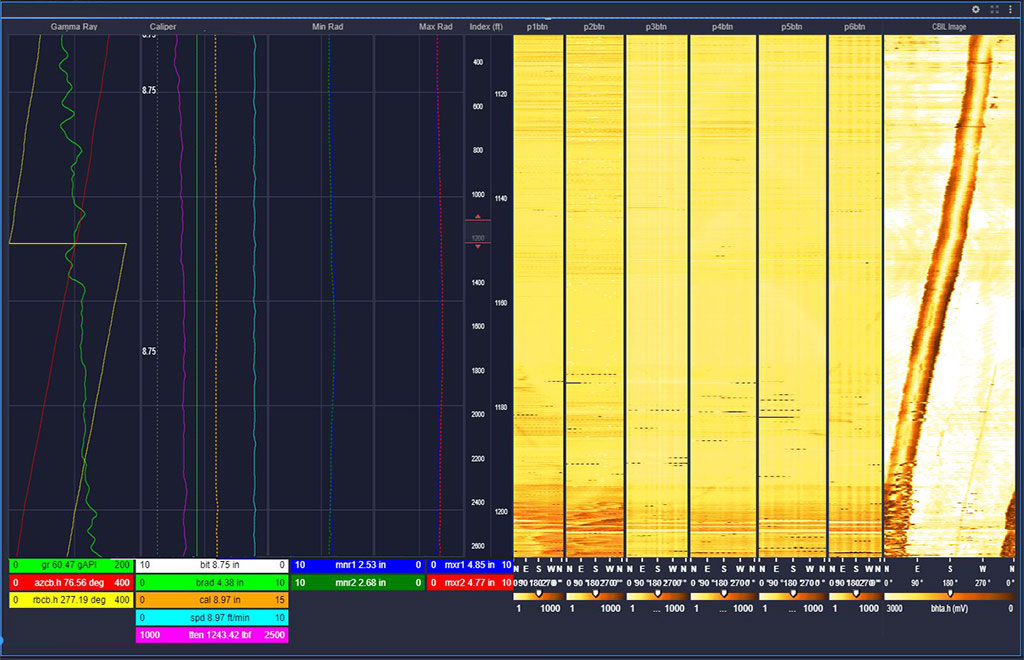
- Triple-combo wireline display
- On-the-fly UoM conversion