- Petrolink
- Technology
- Shift your drilling up a gear with Heatmaps!
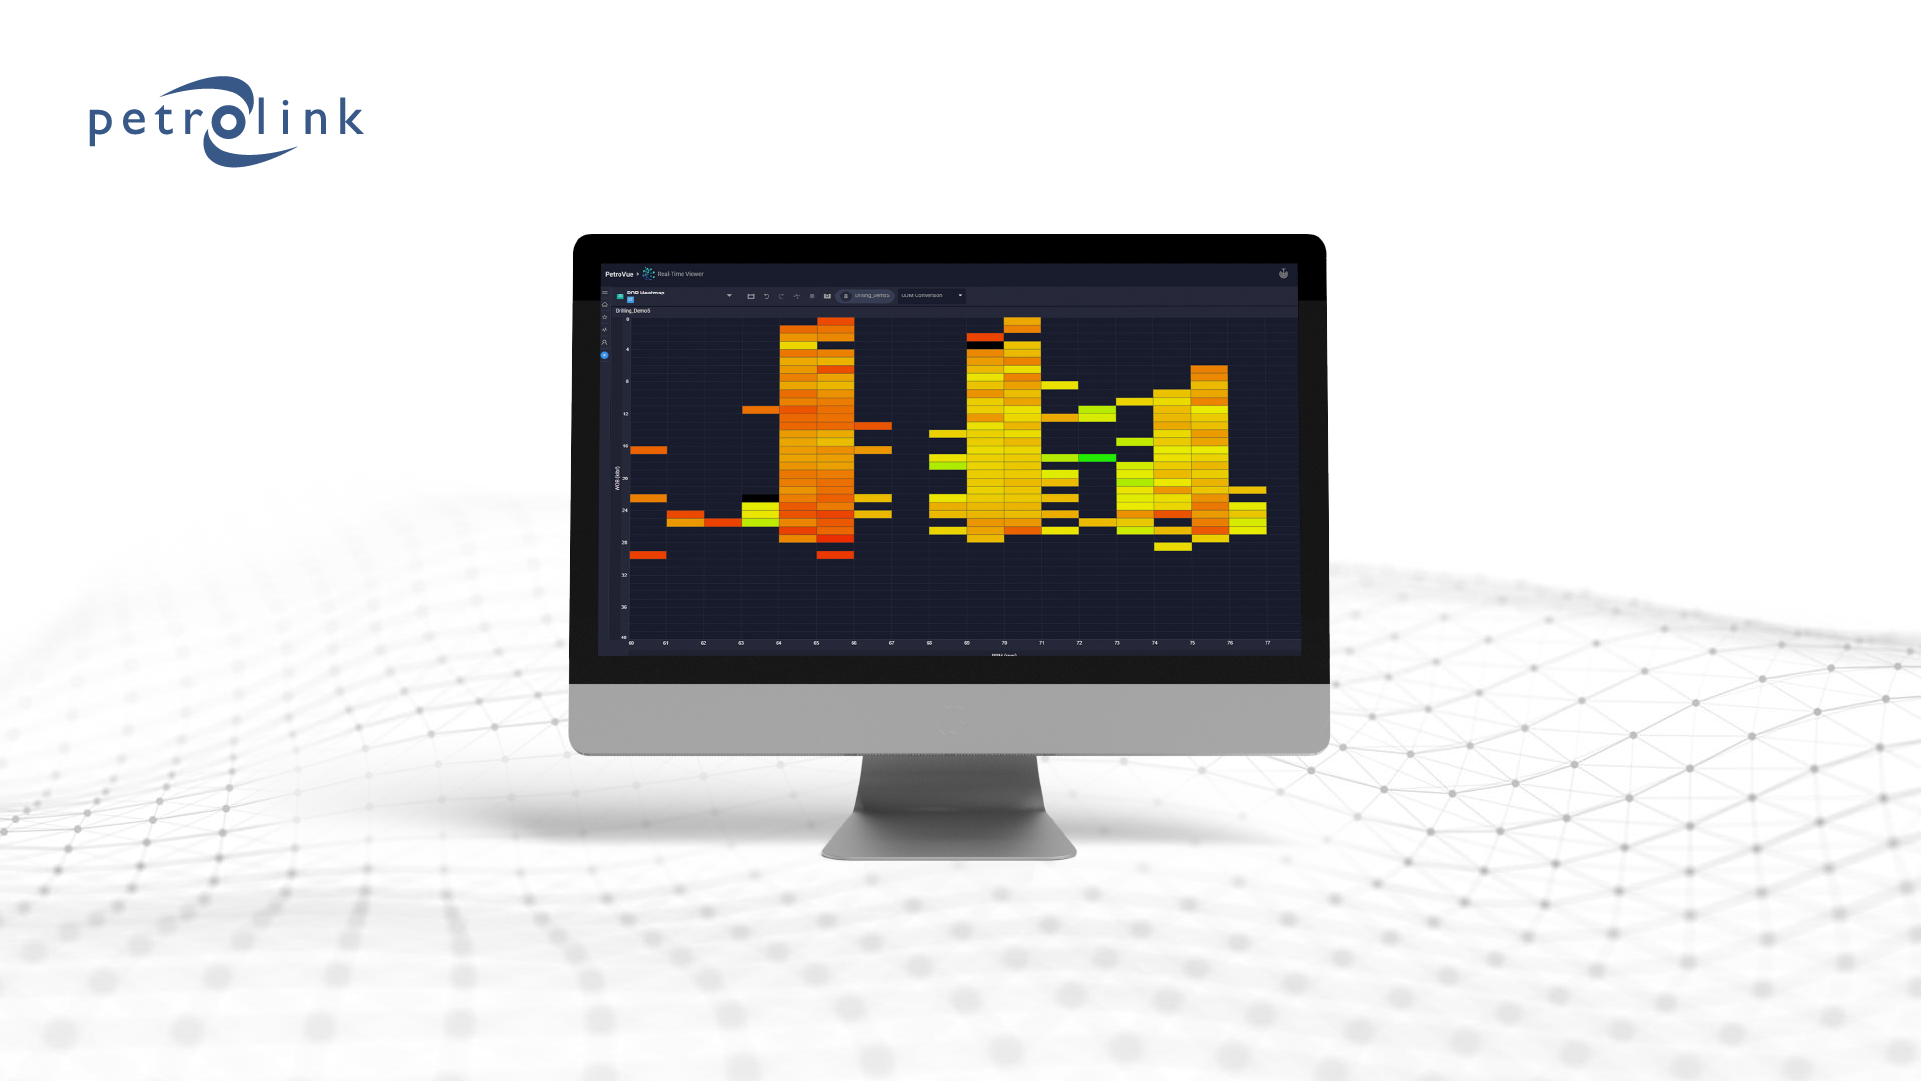
Shift your drilling up a gear with Heatmaps!
At the rigsite a picture is worth a thousand data points. Your drilling team – engineers, tool pushers and geoscientists often spend too long wading through large volumes of data to decipher patterns, subtle rates of change, and thresholds being breached. It remains a challenge across the sector.
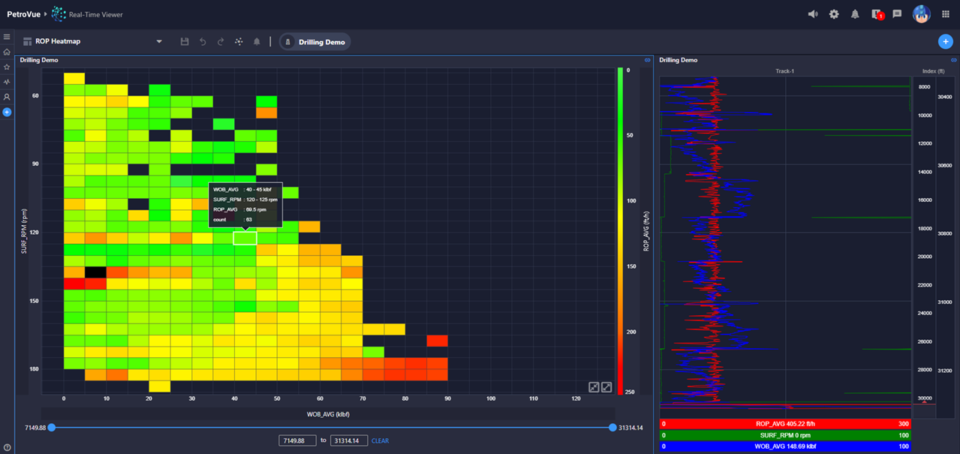
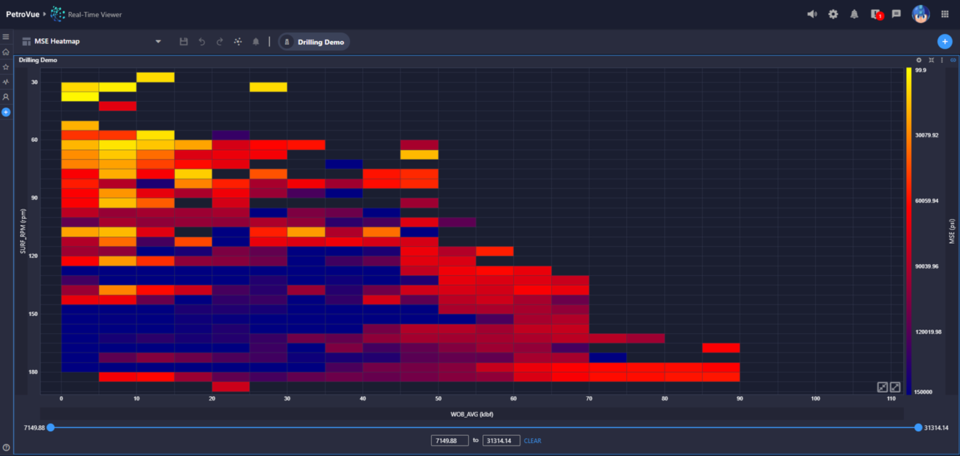
PetroVue™ Heatmaps displays were developed to meet this problem head-on. Plotting the interaction between three key variables RPM/WOB vs ROP or MSE. Colors change in real-time giving an immediate visual on whether drilling is in the sweet spot or if action needs to be taken.
Real-time recommendations
We embedded Heatmaps within PetroVue so users can forget about jumping to another piece of software – to update models, push that data back, before decisions can be taken. Every minute of rig time is precious there simply isn’t time. All real-time data, drilling parameters, LWD logs are available in the same platform meaning drillers can take direct action and adjust parameters where the rubber meets the road – at the wellsite.
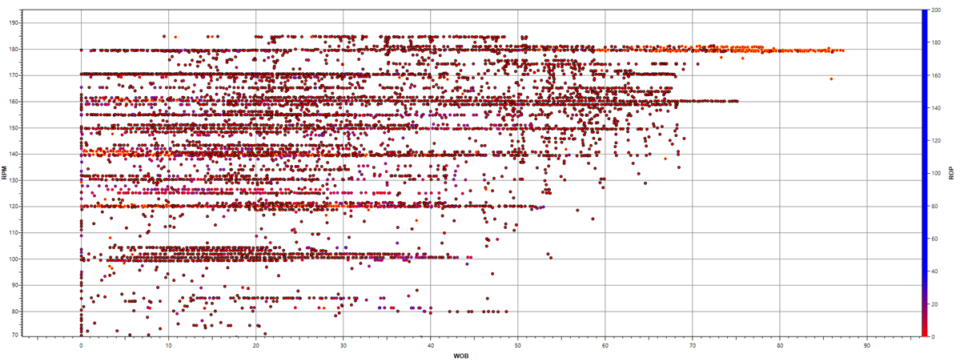
Cut through data noise
Scatter plots can only get you so far. Instantaneous changes in WOB and RPM must be tracked but when there are so many data points, it is simply impossible to keep track, relationships between variables are quickly obscured the result is over-plotting.
Features
- Flexible MSE – implement your propriety MSE calculations in the system.
- Automatic bin size selection based on scaling.
- Drag and drop curves from other widgets.
- One click switches between heat map and marker.
- Interwidget communication for easy correlation with LWD logs.
- Distribution count for quick identification of outliers.
- Easy selection of gradient color from predefined color map library.
With PetroVue Heatmaps your subsurface and drilling departments around the world now have an extra tool in their analytics arsenal. Backed by 30 years of real-time experience; the algorithms behind the graphics have been battle-tested across a variety of basins and verified by our in-house drilling advisory team. Say good-bye to guestimates, blanket field development approaches – each well is unique, and formations responds differently to the drill bit – empower your team with PetroVue Heatmaps.
Our customers are already gaining access to a whole new level of understanding fuelling smarter decisions. Contact us today to join them.
You requested it and we delivered. Heatmaps are the latest ground-breaking feature to be added to PetroVue.