Achieved excellent gas quality range for carrying out gas analysis by replacing gas extraction equipment
The Challenges
During a trial with a National Oil Company it was observed that the gas data (chromatography and total gas) received from the surface logging contractor was of questionable quality for performing gas quality analysis which in turn was providing misleading results for the estimation of the hydrocarbon concentration.
Upon investigation it was observed that the total gas content often did not match the chromatography. This is common when either one of the gas instruments is not correctly calibrated, or defective, or the mud gas extraction is intermittent in the lack of a suitable trap.
Since the operator had no real-time analytical solutions, the problem had not been observed in the past. Before Petrolink’s solution was implemented, the Operator had to rely on post-well data analysis.
The Solution
Petrolink implemented its gas data analytical solution for the analysis of the contractor’s data. The solution involved constant monitoring of gas data to determine if the data was falling within the correct gas data quality window. If it doesn’t, it is considered questionable for advanced gas analysis.
The gas QC equation applied (below) is the universal gas quality ratio formula for FID-type detectors:
| Gas Quality Ratio = GQR = TG / (C1 + 2*C2 + 3*C3 + 4*(iC4 + nC4) + 5*(iC5 + nC5)) | |
| TG – Total Gas C1 – Methane Component C2 – Ethane Component C3 – Propane Component |
IC4 – Iso butane Component NC4 – Normal Butane Component NC5 – Normal Pentane Component IC5 – Iso Pentane Component |
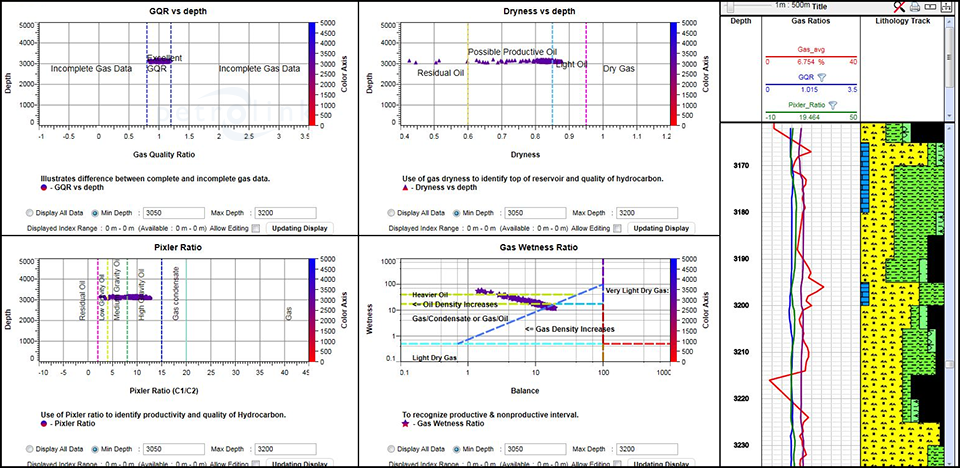
Petrolink also utilized its all-in-one display during the entire pilot for different methods of gas quality ratio which was useful for detection of reservoir fluids such as:
Gas Dryness Method:
To identify top of reservoir and quality of hydrocarbon.
Pixler Ratio:
To identify productivity and quality of hydrocarbon.
Haworth’s Method (Gas Wetness Ratio):
To recognize productive and non-productive intervals.
Using these methods for visualization in one display the quality check and detection of reservoir fluids can be performed at once which was helpful to determine whether the detected fluids were from the good quality gas data or not.
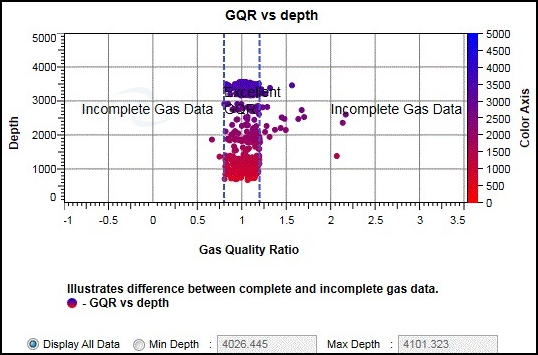
Image depicting the incomplete gas data quality
Complete gas data quality
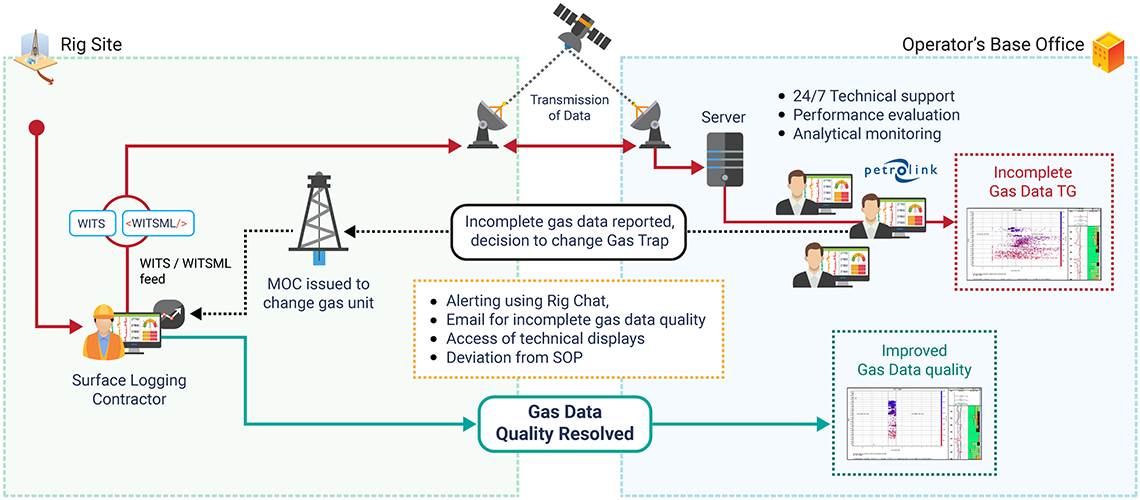
Workflow for Effective Decision Making
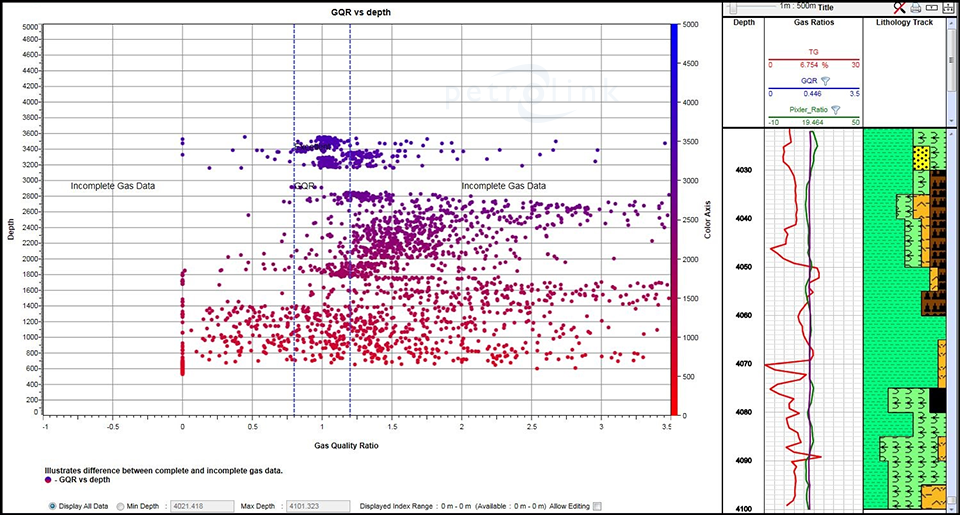
GQR before changing to CVD
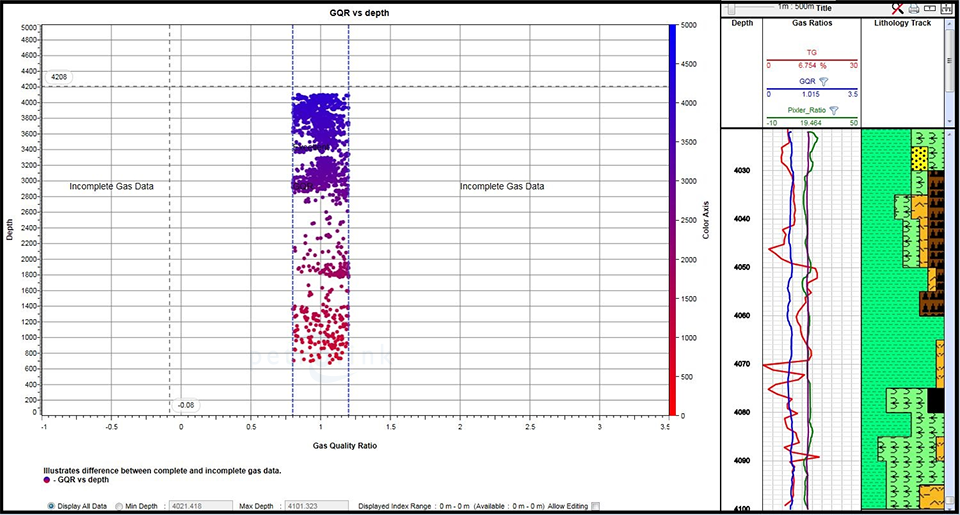
GQR after changing to CVD
The Results
While the checks were performed for the well, it was observed that large sections of the gas data were going out of the GQR window due to issues with the extraction of the gas sample from the mud. The Operator requested the vendor replace the conventional degasser system with a constant volume gas trap system (CVD), granting a more stable mud gas sampling.
After moving to a CVD system, the gas data quality check was performed again and data quality was improved by 60%.
The analysis was performed for more than 10 wells and it helped the operator to determine the best pay zones for perforation tests.
The optimum operational technique was properly applied by the contractor and the systems were carefully calibrated thereafter to obtain excellent gas data quality.
Future Plans
Going forward, the operator has asked the contractor to utilize a high end gas extraction system to achieve better gas data quality.
The Petrolink analytical solution has greatly helped to determine the perforation zones for further testing with an indication of expected hydrocarbon type.
Head of Exploration Operations


