logo-wireline-viewer

Wireline Viewer

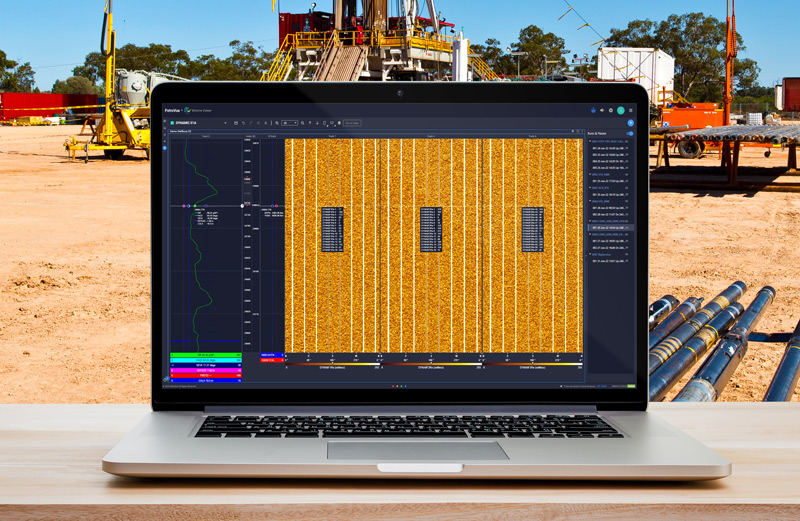
The Wireline application allows you to monitor and review data from runs and passes. Every foot of wireline data matters- with tool responses indicating changes in the overburden or reservoir. When paired with real-time LWD and time-based logs the subsurface team is equipped with the data they need to make decisions on the optimal strategy to complete the well.

The dedicated Wireline Viewer provides a comprehensive view of wireline data.

  • Visualize high-resolution data
  • Log up and log down
  • Split logs to cover runs and passes
  • Triple-combo wireline display
  • On-the-fly UoM conversion

Visualize data from runs and passes

Wireline data is organised by well and run. Passes are listed under the run.
Templates can be associated with particular runs and passes for quick and consistent data displays.

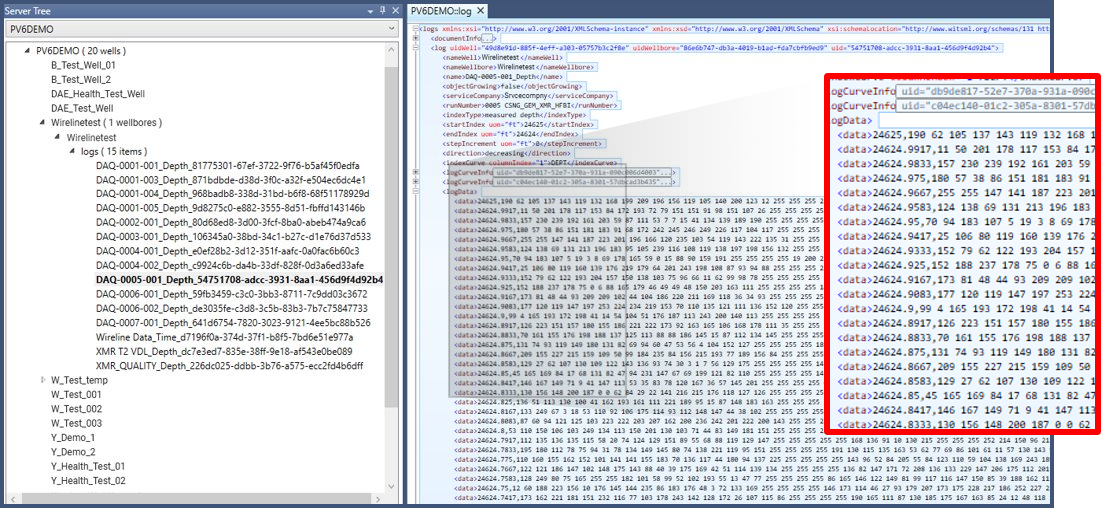
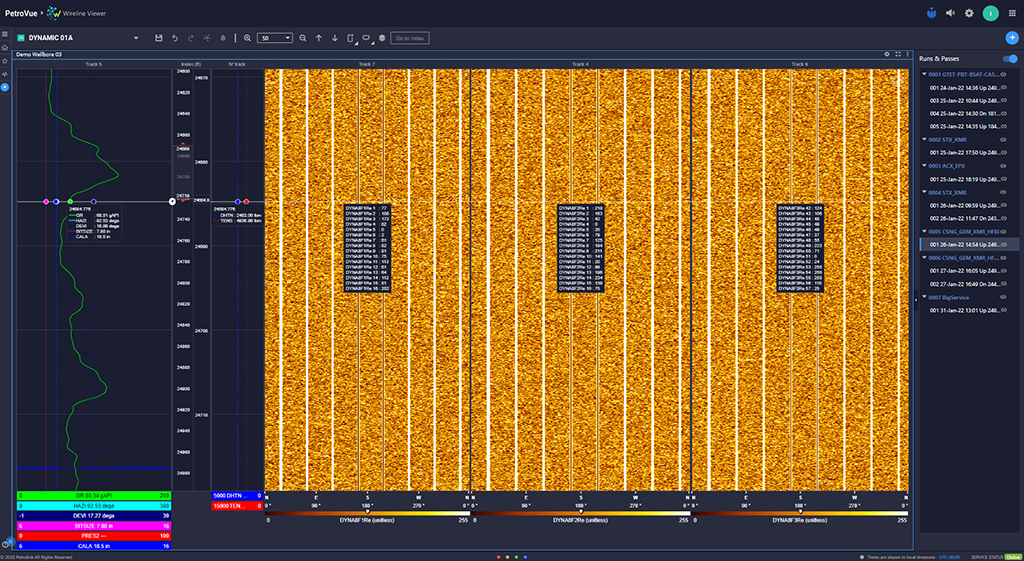
Display high density image data

Running wireline generates large volumes of high density data. The Wireline displays in PetroVue can display high density data with ease and support the industry standards for image arrays.

With Wireline displays in PetroVue a vast amount of data is now at the user’s fingertips, ready to be acted upon by the subsurface team.

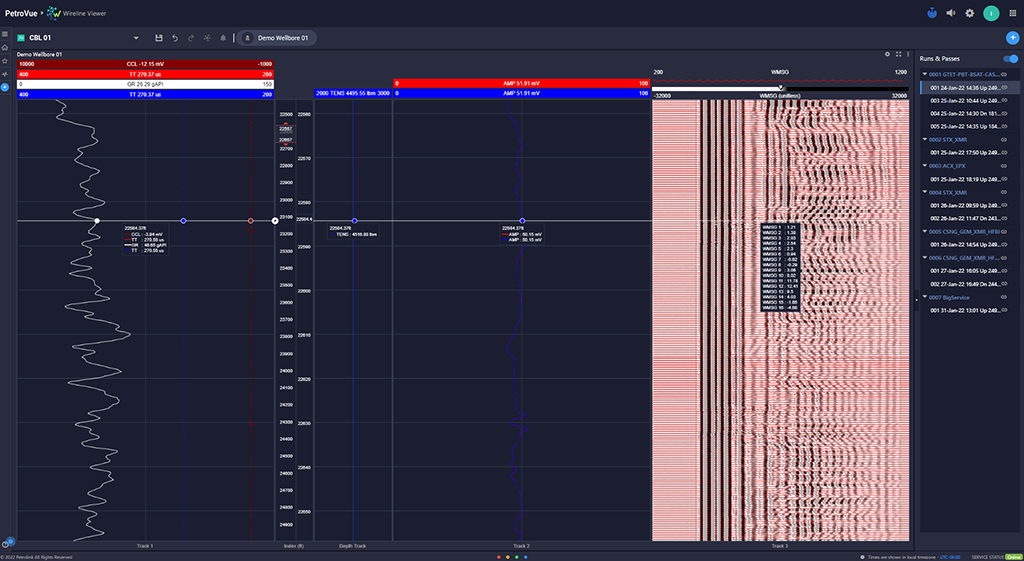
Cement Bond Logs (CBL)

Checking the quality of a cement job is vital to ensuring the integrity of the well.
View data for runs and passes and spot any channelling which may indicate a sub-optimal cementing operation.

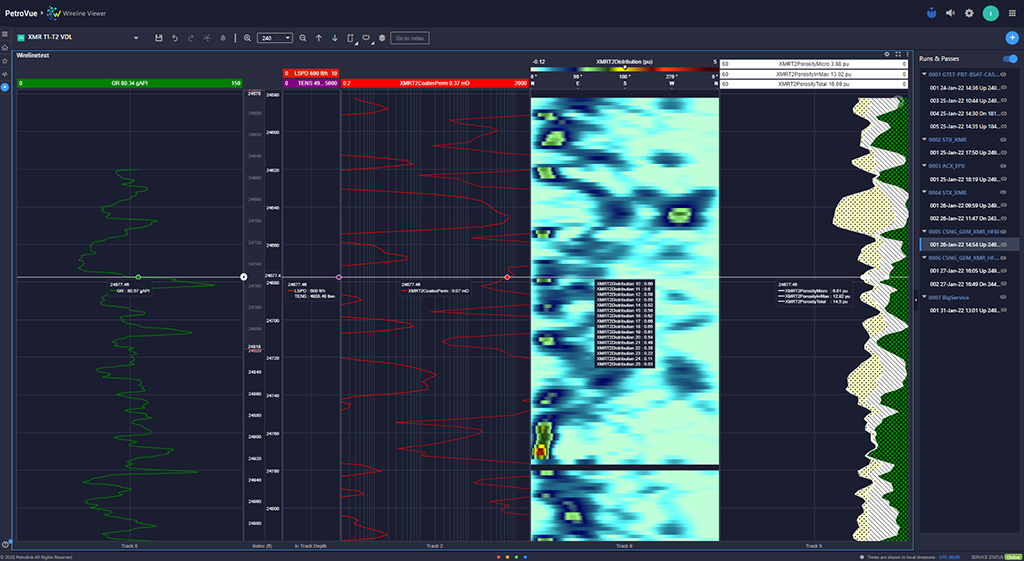
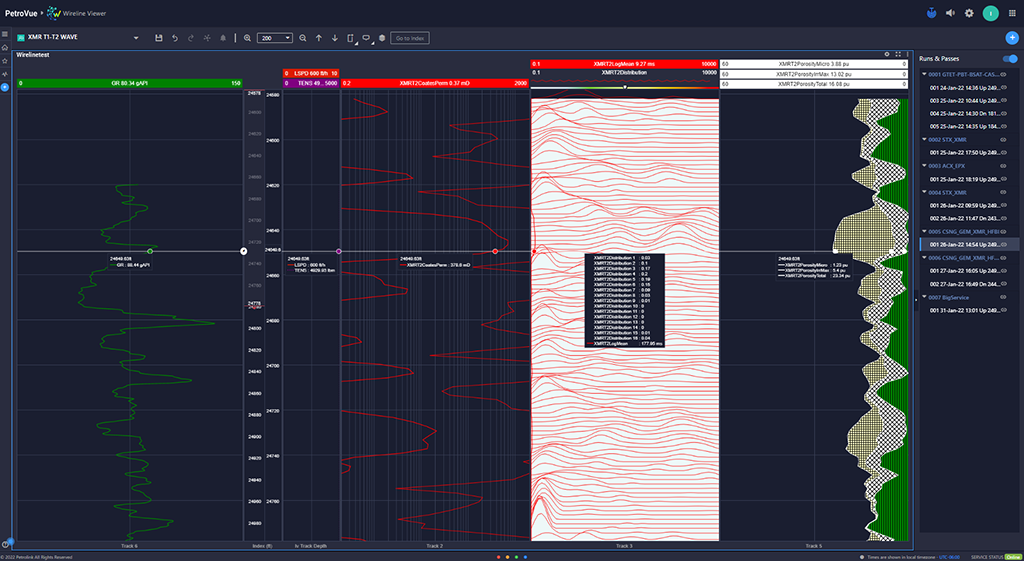
Nuclear Magnetic Resonance (NMR) Logs

Realise the full value of NMR data with NMR Wireline Logs. Visualize a 360-degree, full resolution image of the borehole. Plot porosity data alongside the NMR image for cross-comparison, enabling specialists to spot zones of interest.

Multi-Pad Wireline Logs

Take a holistic view of multiple-well performance data or drill down into a single logging run.

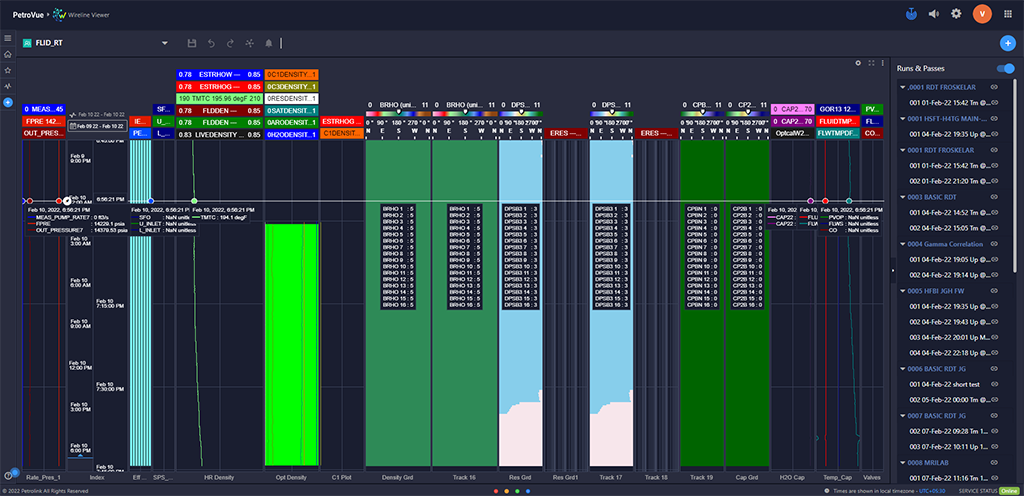
Time Based Wireline Image Logs

In PetroVue there is no reason to neglect time-based wireline data. Comprehensive displays such as this composite log include the full suite of time data, including – tension, hoist, and fluid temperature.

Highlights

  • Visualize data from runs and passes
  • Display high density image data
  • Link templates to runs and passes
  • Time based data and array data
  • Create private templates

Wireline displays in PetroVue mean our clients can now view crucial wireline data in real-time as it is collected at the rig. This means taking key decisions – such as do we need to make further logging runs can be taken with the full range of data in view, potentially reducing project costs.