Introduction
The well has been drilled to TD and the LWD tools are now back at the surface and the memory data downloaded.
But that need not be where the flow of real-time data stops and the value of PetroVue ends.
On many wells, it is time for the wireline trucks to roll in and open – or cased-hole logging operations to begin. At Petrolink, we have built a battle-tested, flexible Wireline Viewer system to visualize all the wireline data collected at the rigsite.
Challenges
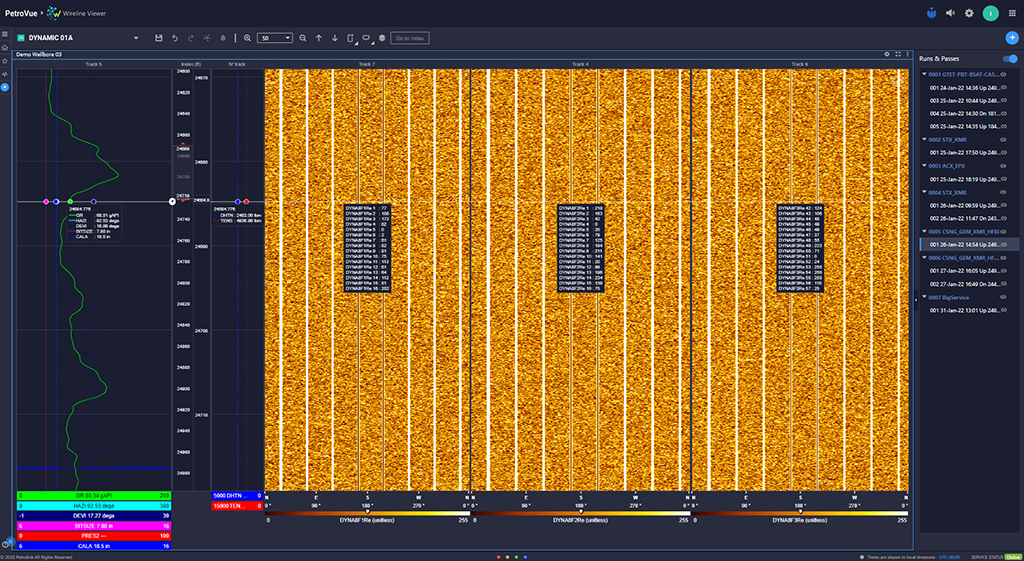
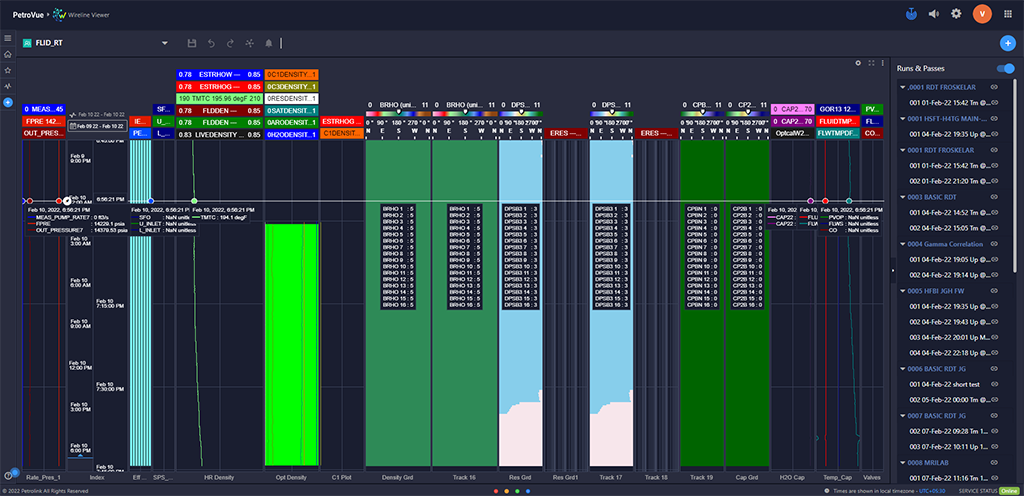
Wireline data is some of the highest resolution data that wellsite operations produce. It is common to see high-frequency data composed of large amounts of sector arrays. Often, there can be more than 100 data points in a single interval, with each having a huge 200+ data values.
Many legacy systems were prone to locking up. They simply could not cope with – or indeed transmit – the vast amount of data wireline runs produce.
The result? Data can become siloed at the rigsite. The subsurface teams are then left in the dark as to how the wireline operations are progressing. This often resulted in teams relying on guesswork to make a call on further logging passes.

Acquisition to Analytics
At Petrolink, we have led the way in real-time data transmission. Twenty years ago, we were the first independent company to implement real-time data sharing based on the Energistics standard. Today, we are driven by that same level of innovation – focusing on data across the whole well lifecycle and that includes wireline data.
As a vendor-neutral provider, we ensure the integrity of the information collected without smoothing or adjusting the data. With our data quality algorithms running in the background, users can be confident that the data they see is a true reflection of the downhole environment.
Solve Logging Challenges
Wireline displays in PetroVue are a gamechanger. Lightning fast, responsive, and pairable with real-time LWD data. You can take a holistic view of the multi-well performance or drill down into a single logging run.
Benefits
- Track cable tension to maintain clear depth correction.
- In extreme downhole environments where up-logging is not possible, the displays also visualize down-logging.
- Take a comprehensive look at the full suite of time data – including tension, hoist and fluid temperature.
- Open hole logging or case hole logging
Displays
- Triple-Combo Logs – Bring triple-combo data into view.
- Time-Based Logs – Customizable widget gauges provide up to the second data for both the wireline operators at the rig and those watching remotely.
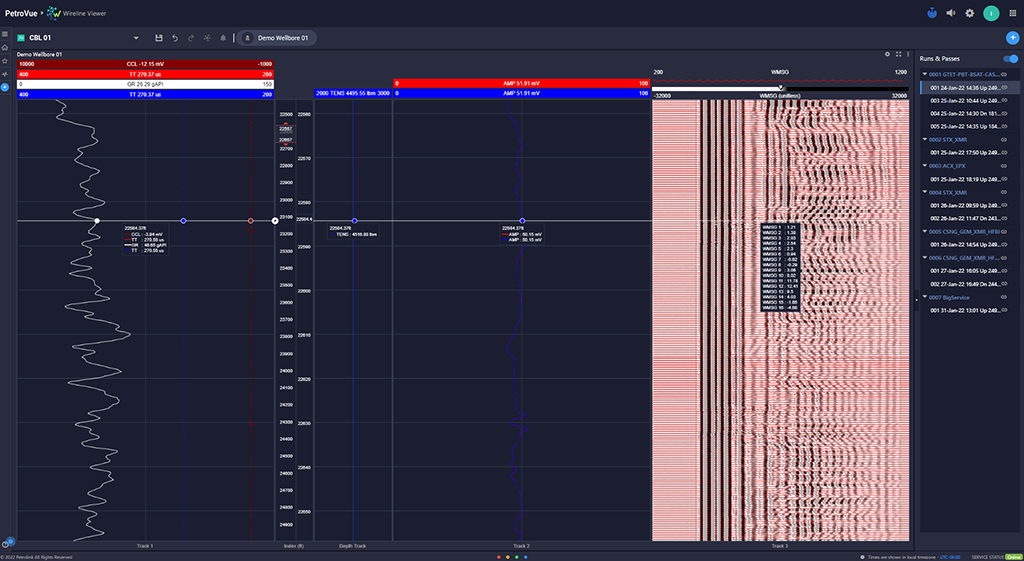
- Cement Bond Logs (CBL) Logs – Check the quality of a cement job to ensure the integrity of the well.
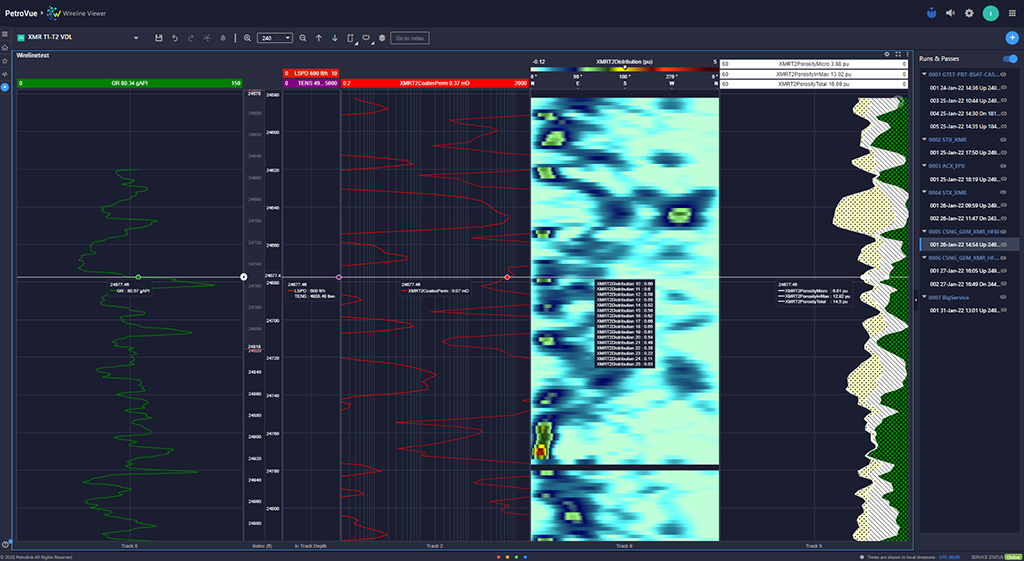
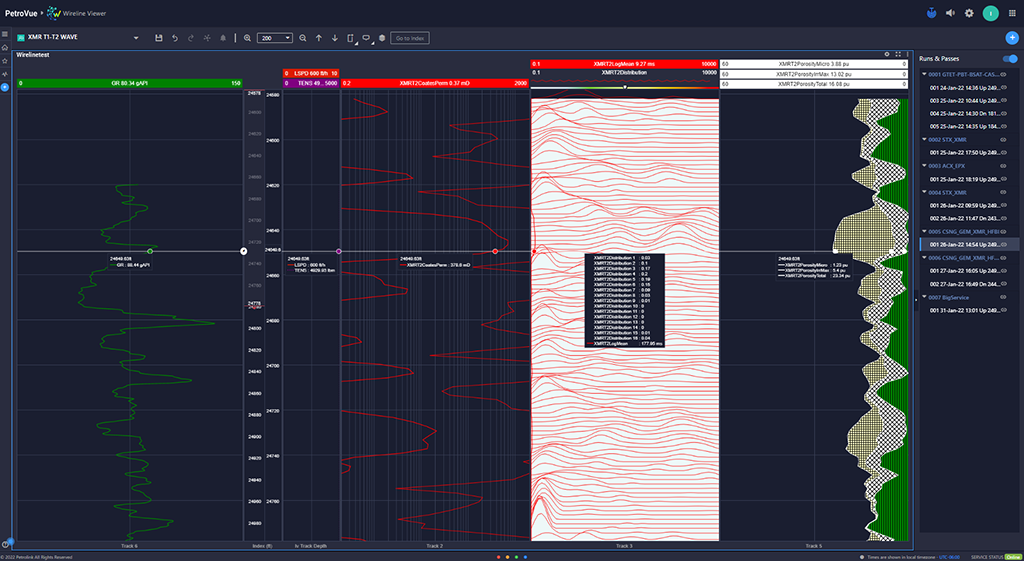
- NMR Logs – Visualize a 360-degree, full resolution log of images of the borehole.
- Multi-Pad Logs – Compare multi-well performance data.
The versatility and flexibility of the PetroVue framework mean an infinite number of configurations are available. Want to plot real-time Gamma-Resistivity-Density information alongside the wireline run data? Or need to benchmark logging performance across offset wells? No problem.
With PetroVue, the possibilities are endless:
- Visualize high-resolution data.
- View log up and log down runs.
- Split logs into runs and passes.
- On-the-fly UoM conversion.
Intuitive
Our Wireline Viewer is fully embedded within the PetroVue framework. If you are an existing PetroVue user, you won’t need to invest time and resources in learning a new system. Defined templates can be associated with a particular well or campaign, so you are able to quickly spin up displays to accommodate batched logging projects.
Smarter Wireline Runs
Previously, wireline data remained confined to the rigsite – being delivered on a hard disk, long after the rig has skidded off location. With Wireline Viewer in PetroVue, our clients can now view that data in real-time as it is collected at the rig. Make key decisions, answer important questions, and enable drillers to optimise further logging runs and reduce project costs.


